The average prices of both crude oil and natural gas in the United States were the highest since 2008. Proved reserves of crude oil and natural gas hit record highs for the United States in 2022. Proved reserves are estimated volumes of hydrocarbon resources that analysis of geologic and engineering data demonstrates with reasonable certainty are recoverable under existing economic and operating conditions. Reserves estimates change from year to year because of: To prepare this report, we collect independently developed estimates of proved reserves with Form EIA-23L from a sample of U.S. operators of oil and natural gas fields. We use this sample to further estimate the portion of proved reserves from operators who do not report. This year, we received responses from 397 of 404 sampled operators, which provided coverage of about 90% of proved reserves of oil and 93% of proved reserves of natural gas at the national level. We develop estimates for reserves located in the United States, each state individually, and some state subdivisions. States and regions with subdivisions are: We redesigned Form EIA-23L, Annual Report of Domestic Oil and Gas Proved Reserves, for the 2022 report year. Our goal was to reduce the respondent burden of collecting and reporting proved reserves information. We collected reserves and production data for 2022 at the state, state-subdivision, state waters, and Federal Offshore waters levels in tabular format instead of at the county-level. We collected combined crude oil and lease condensate reserves and production data instead of separate categories. We collected natural gas reserves and production data without distinguishing between associated-dissolved and nonassociated. We stopped collecting reserves and production by three reservoir types (C=conventional, LP=low permeability, and SH=shale) and instead collected the combined total plus subtotals for identified major shale plays. The term natural gas refers to wet after lease separation unless otherwise specified in this report. Natural gas, wet after lease separation is the volume of natural gas remaining after removal of lease condensate in lease and/or field separation facilities, if any, and after exclusion of nonhydrocarbon gases where they occur in sufficient quantity to render the gas unmarketable. The term divestitures is when a respondent transfers or sells proved reserves to other operators during the report year. In previous years, we used the term sales for this volume. We will continue to use the term acquisitions to describe when an operator purchases or receives a transfer of proved reserves from other operators during the report year. Contact: Petroleum and Other Liquids Data, eiainfopetroleum@eia.gov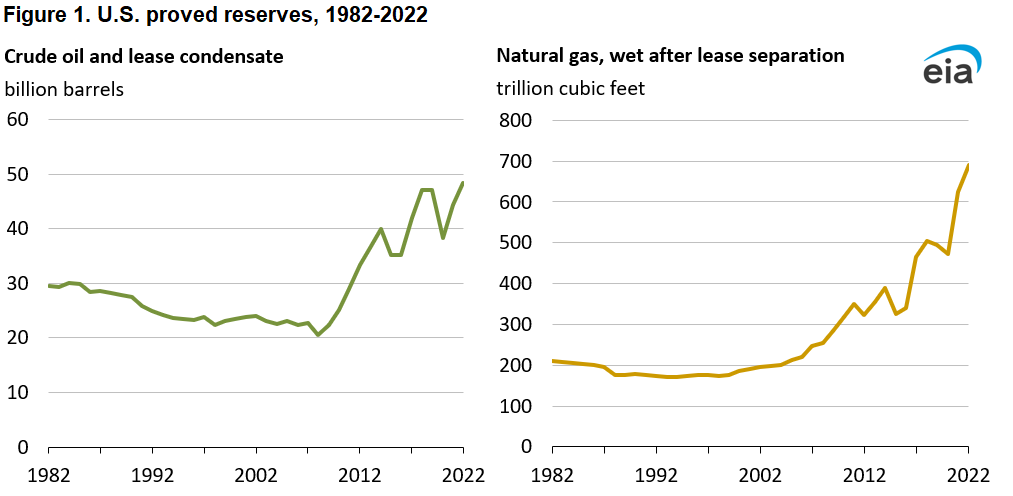
figure data
Oil highlights
Natural gas highlights
New for Report Year 2022
Natural Gas
‹ See All Natural Gas Reports
U.S. Crude Oil and Natural Gas Proved Reserves, Year-end 2022
With Data for 2022 | Release Date: April 29, 2024 | Next Release Date: April 2025
Previous Issues:
Data tables
| 1. U.S. proved reserves, and reserves changes, 2021–22 | XLS | |
| 2. Crude oil and lease condensate production and proved reserves, from shale plays, 2021–22 | XLS | |
| 3. U.S. natural gas, wet after lease separation, reserves changes, by source, 2021–22 | XLS | |
| 4. Natural gas, wet after lease separation, production and proved reserves, from shale plays, 2021–22 | XLS | |
| 5. U.S. crude oil and lease condensate proved reserves, 2012–2022 | XLS | |
| 6. Crude oil and lease condensate proved reserves, reserves changes, by states and areas, 2022 | XLS | |
| 7. U.S. natural gas, wet after lease separation, proved reserves, 2012–22 | XLS | |
| 8. Natural gas, wet after lease separation, proved reserves, reserves changes, by states and areas, 2022 | XLS | |
| 9. Natural gas, wet after lease separation, proved reserves and production of shale plays, by states and areas, 2019–22 | XLS | |
| 10. Natural gas, wet after lease separation, proved reserves, reserves changes from shale plays, by states and areas, 2022 | XLS | |
| 11. Estimated natural gas plant liquids and dry natural gas content of natural gas, wet after lease separation, proved reserves, by states and areas, 2022 | XLS | |
| 12. Proved nonproducing reserves by states, areas, and shale plays, 2022 | XLS |