Iowa Quick Facts
- Iowa is the nation's largest fuel ethanol and biodiesel producer. It accounts for about one-fourth of U.S. fuel ethanol production capacity and almost one-fifth of biodiesel production capacity.
- In 2022, wind turbines generated 62% of Iowa's electricity, the highest wind power share for any state.
- Iowa ranks among the 10 states with the highest electricity sales per capita and is among the 10 states with the lowest average electricity price.
- Iowa is the only non-crude oil-producing state among the top five states in total energy consumption per capita.
- Iowa is the fourth-largest consumer of hydrocarbon gas liquids, mostly propane--which is used for drying the state's large harvested corn crop and for heating one in eight Iowa households.
Last Updated: August 17, 2023
Data
Last Update: April 18, 2024 | Next Update: May 16, 2024
| Prices | |||||
|---|---|---|---|---|---|
| Petroleum | Iowa | U.S. Average | Period | find more | |
| Domestic Crude Oil First Purchase | -- | $ 72.26 /barrel | Jan-24 | ||
| Natural Gas | Iowa | U.S. Average | Period | find more | |
| City Gate | NA | $ 4.76 /thousand cu ft | Jan-24 | find more | |
| Residential | $ 7.60 /thousand cu ft | $ 11.82 /thousand cu ft | Jan-24 | find more | |
| Coal | Iowa | U.S. Average | Period | find more | |
| Average Sales Price | -- | $ 54.46 /short ton | 2022 | ||
| Delivered to Electric Power Sector | $ 1.97 /million Btu | $ 2.48 /million Btu | Jan-24 | ||
| Electricity | Iowa | U.S. Average | Period | find more | |
| Residential | 11.85 cents/kWh | 15.45 cents/kWh | Jan-24 | find more | |
| Commercial | 9.73 cents/kWh | 12.68 cents/kWh | Jan-24 | find more | |
| Industrial | 6.49 cents/kWh | 8.10 cents/kWh | Jan-24 | find more | |
| Reserves | |||||
|---|---|---|---|---|---|
| Reserves | Iowa | Share of U.S. | Period | find more | |
| Crude Oil (as of Dec. 31) | -- | -- | 2021 | find more | |
| Expected Future Production of Dry Natural Gas (as of Dec. 31) | -- | -- | 2021 | find more | |
| Expected Future Production of Natural Gas Plant Liquids | -- | -- | 2021 | find more | |
| Recoverable Coal at Producing Mines | -- | -- | 2022 | find more | |
| Rotary Rigs & Wells | Iowa | Share of U.S. | Period | find more | |
| Natural Gas Producing Wells | -- | -- | 2020 | find more | |
| Capacity | Iowa | Share of U.S. | Period | ||
| Crude Oil Refinery Capacity (as of Jan. 1) | -- | -- | 2023 | ||
| Electric Power Industry Net Summer Capacity | 22,696 MW | 1.9% | Jan-24 | ||
| Supply & Distribution | |||||
|---|---|---|---|---|---|
| Production | Iowa | Share of U.S. | Period | find more | |
| Total Energy | 959 trillion Btu | 1.0% | 2021 | find more | |
| Crude Oil | -- | -- | Jan-24 | find more | |
| Natural Gas - Marketed | -- | -- | 2022 | find more | |
| Coal | -- | -- | 2022 | find more | |
| Total Utility-Scale Net Electricity Generation | Iowa | Share of U.S. | Period | find more | |
| Total Net Electricity Generation | 6,213 thousand MWh | 1.6% | Jan-24 | ||
| Utility-Scale Net Electricity Generation (share of total) | Iowa | U.S. Average | Period | ||
| Petroleum-Fired | 0.2 % | 0.4 % | Jan-24 | find more | |
| Natural Gas-Fired | 14.3 % | 42.2 % | Jan-24 | find more | |
| Coal-Fired | 29.3 % | 19.9 % | Jan-24 | find more | |
| Nuclear | 0.0 % | 18.2 % | Jan-24 | find more | |
| Renewables | 56.2 % | 18.8 % | Jan-24 | ||
| Stocks | Iowa | Share of U.S. | Period | find more | |
| Motor Gasoline (Excludes Pipelines) | 32 thousand barrels | 0.3% | Jan-24 | ||
| Distillate Fuel Oil (Excludes Pipelines) | 2,877 thousand barrels | 2.9% | Jan-24 | find more | |
| Natural Gas in Underground Storage | 239,250 million cu ft | 3.4% | Jan-24 | find more | |
| Petroleum Stocks at Electric Power Producers | 70 thousand barrels | 0.3% | Jan-24 | find more | |
| Coal Stocks at Electric Power Producers | 4,752 thousand tons | 3.9% | Jan-24 | find more | |
| Fueling Stations | Iowa | Share of U.S. | Period | ||
| Motor Gasoline | 1,690 stations | 1.5% | 2021 | ||
| Propane | 34 stations | 1.4% | Mar-24 | ||
| Electric Vehicle Charging Locations | 362 stations | 0.6% | Mar-24 | ||
| E85 | 331 stations | 7.7% | Mar-24 | ||
| Biodiesel, Compressed Natural Gas, and Other Alternative Fuels | 351 stations | 12.4% | Mar-24 | ||
| Consumption & Expenditures | |||||
|---|---|---|---|---|---|
| Summary | Iowa | U.S. Rank | Period | ||
| Total Consumption | 1,566 trillion Btu | 24 | 2021 | find more | |
| Total Consumption per Capita | 490 million Btu | 5 | 2021 | find more | |
| Total Expenditures | $ 16,773 million | 28 | 2021 | find more | |
| Total Expenditures per Capita | $ 5,245 | 7 | 2021 | find more | |
| by End-Use Sector | Iowa | Share of U.S. | Period | ||
| Consumption | |||||
| » Residential | 231 trillion Btu | 1.1% | 2021 | find more | |
| » Commercial | 185 trillion Btu | 1.1% | 2021 | find more | |
| » Industrial | 852 trillion Btu | 2.6% | 2021 | find more | |
| » Transportation | 297 trillion Btu | 1.1% | 2021 | find more | |
| Expenditures | |||||
| » Residential | $ 2,917 million | 1.0% | 2021 | find more | |
| » Commercial | $ 1,877 million | 0.9% | 2021 | find more | |
| » Industrial | $ 5,168 million | 2.2% | 2021 | find more | |
| » Transportation | $ 6,811 million | 1.1% | 2021 | find more | |
| by Source | Iowa | Share of U.S. | Period | ||
| Consumption | |||||
| » Petroleum | 88 million barrels | 1.2% | 2021 | find more | |
| » Natural Gas | 438 billion cu ft | 1.4% | 2022 | find more | |
| » Coal | 13,003 thousand short tons | 2.5% | 2022 | find more | |
| Expenditures | |||||
| » Petroleum | $ 9,190 million | 1.2% | 2021 | find more | |
| » Natural Gas | $ 4,031 million | 1.5% | 2022 | find more | |
| » Coal | $ 418 million | 1.6% | 2022 | find more | |
| Consumption for Electricity Generation | Iowa | Share of U.S. | Period | find more | |
| Petroleum | 27 thousand barrels | 1.0% | Jan-24 | find more | |
| Natural Gas | 6,745 million cu ft | 0.6% | Jan-24 | find more | |
| Coal | 1,065 thousand tons | 2.5% | Jan-24 | find more | |
| Energy Source Used for Home Heating (share of households) | Iowa | U.S. Average | Period | ||
| Natural Gas | 59.6 % | 46.2 % | 2022 | ||
| Fuel Oil | 0.3 % | 3.9 % | 2022 | ||
| Electricity | 24.4 % | 41.3 % | 2022 | ||
| Propane | 13.4 % | 5.0 % | 2022 | ||
| Other/None | 2.4 % | 3.5 % | 2022 | ||
| Environment | |||||
|---|---|---|---|---|---|
| Renewable Energy Capacity | Iowa | Share of U.S. | Period | find more | |
| Total Renewable Energy Electricity Net Summer Capacity | 13,293 MW | 3.9% | Jan-24 | ||
| Ethanol Plant Nameplate Capacity | 4,830 million gal/year | 27.3% | 2023 | ||
| Renewable Energy Production | Iowa | Share of U.S. | Period | find more | |
| Utility-Scale Hydroelectric Net Electricity Generation | 58 thousand MWh | 0.3% | Jan-24 | ||
| Utility-Scale Solar, Wind, and Geothermal Net Electricity Generation | 3,418 thousand MWh | 7.4% | Jan-24 | ||
| Utility-Scale Biomass Net Electricity Generation | 15 thousand MWh | 0.4% | Jan-24 | ||
| Small-Scale Solar Photovoltaic Generation | 21 thousand MWh | 0.4% | Jan-24 | ||
| Fuel Ethanol Production | 97,418 thousand barrels | 27.2% | 2021 | ||
| Renewable Energy Consumption | Iowa | U.S. Rank | Period | find more | |
| Renewable Energy Consumption as a Share of State Total | 38.2 % | 4 | 2021 | ||
| Fuel Ethanol Consumption | 4,223 thousand barrels | 28 | 2021 | ||
| Total Emissions | Iowa | Share of U.S. | Period | find more | |
| Carbon Dioxide | 73.1 million metric tons | 1.5% | 2021 | ||
| Electric Power Industry Emissions | Iowa | Share of U.S. | Period | find more | |
| Carbon Dioxide | 26,163 thousand metric tons | 1.6% | 2022 | ||
| Sulfur Dioxide | 23 thousand metric tons | 2.1% | 2022 | ||
| Nitrogen Oxide | 26 thousand metric tons | 2.1% | 2022 | ||
Analysis
Last Updated: August 17, 2023
Overview
Located between the Mississippi and Missouri rivers, Iowa's gently rolling plains have some of the richest farmland in the nation and significant renewable energy resources. The state's climate, with rainfall in the growing season and dry air at harvest, together with Iowa's deep topsoil, produce abundant grain crops.1 Iowa leads the nation in the production of both corn and ethanol.2,3 Along with corn stalks, wind turbines rise above the prairie grasses throughout the state. Unobstructed winds blow across Iowa's open prairie, giving the state significant wind energy resources.4 With many days of sunshine each year, Iowa has solar energy potential as well.5,6 However, the state has few economically recoverable fossil energy reserves and no crude oil, natural gas, or coal production.7,8,9,10
Iowa ranks among the top 5 states in per capita total energy consumption.
Iowa is the only non-crude oil-producing state among the top five states in total energy consumption per capita, mainly because of its small population and large industrial sector.11 The industrial sector leads Iowa's end-use energy consumption, accounting for slightly more than half of the state total.12 Iowa ranks among the top 10 states in total industrial sector energy use.13 Agriculture, food production, biofuels production, and manufacturing are key Iowa industries.14 The state's major manufactured products include machinery; food and beverages; chemicals; computers and electronics; plastics; and motor vehicles and parts.15 The transportation sector is the second-largest energy user, accounting for almost one-fifth of the state's total. The residential sector makes up about one-seventh of the state's energy consumption and the commercial sector accounts for about one-eighth.16
Renewable energy
Iowa produces more fuel ethanol and biodiesel than any other state in the nation.
Iowa is the top fuel ethanol-producing state in the nation and has about one-fourth of the nation's total fuel ethanol production capacity. The state's ethanol plants can produce nearly 4.7 billion gallons per year, which is almost 30 times greater than the 177 million gallons of ethanol consumed annually in the state. Iowa's fertile cornfields provide the feedstock for the state's 41 ethanol plants.17,18,19,20 Iowa also leads the nation in biodiesel production. Its 11 biodiesel plants have a combined production capacity of 470 million gallons per year, which is one-fifth of the nation's total capacity and the largest biodiesel production capacity of any state. Iowa's biodiesel production is almost eight times larger than the state's biodiesel use of about 63 million gallons a year.21,22,23
In 2022, 62% of Iowa’s total electricity net generation came from wind, the largest wind power share of any state.
In 2022, nearly two-thirds of Iowa's total electricity net generation came from renewable resources, almost all of it from wind.24 The state was the second-largest wind power producer, after Texas. Wind energy powered 62% of Iowa's net generation, the highest share of any state. Iowa's wind power is expected to increase, as about 224 megawatts of new wind power generating capacity are scheduled to come online in 2023.25,26 The strongest winds occur in northwestern Iowa, and although there are wind farms across the state, most are in the state's northern and western areas.27,28
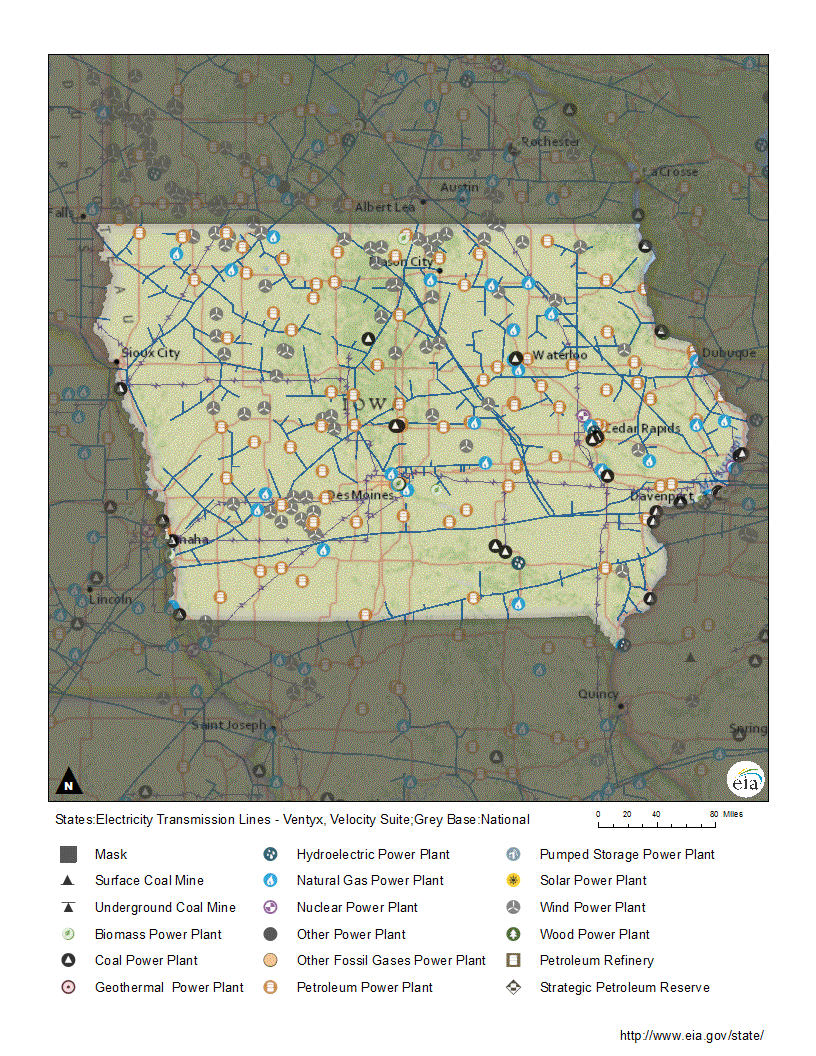
About 3% of Iowa's in-state electricity generation in 2022 came from renewable energy resources other than wind, with hydroelectric power, solar energy, and biomass each contributing a small amount of the state's electricity.29 The largest of Iowa's four hydroelectric power plants—the Keokuk plant with 15 turbine generators and 146 megawatts of generating capacity—is 110 years old. It is the largest privately-owned and operated dam and hydroelectric plant on the Mississippi River.30,31 Nearly three-fifths of the state's small, but growing, solar power supply is provided by utility-scale (1 megawatt or larger) solar arrays and about two-fifths come from customer-sited, small-scale generating systems (less than 1 megawatt each).32 The state's largest solar generating facility, the 100-megawatt Holiday Creek Solar Farm, came online in mid-2022.33 Iowa's best solar power resources are found in the southwestern corner of the state.34 The state's biomass resources include landfill gas and agricultural biodigesters that both produce methane gas as fuel for electricity-generating facilities. The largest biomass-fueled generating plant is an 11-megawatt facility located near Des Moines that uses methane produced from a landfill.35,36,37 Iowa's biomass resources also provide feedstock to the state's one wood pellet plant, which can process wood waste into 10,000 tons of pellets annually.38
In 1983, Iowa became the first state in the nation to adopt a renewable portfolio standard (RPS). State regulators required Iowa's two investor-owned electric utilities to own or to contract for a combined 105 megawatts of total renewable generating capacity.39 Capacity from eligible renewable resources has far exceeded the RPS goals. At the beginning of 2023, Iowa had about 12,800 megawatts of in-state generating capacity fueled by renewable energy sources at utility-scale power facilities.40
Electricity
In 2019, wind turbines in Iowa generated more electricity than the state's coal-fired power plants for the first time. In 2022, coal's share declined to 25% of the state's total electricity net generation, which was down from 44% five years earlier. During the same five-year period, wind power grew from 37% of the state's net generation to 62% in 2022. However, 5 of Iowa's 10 largest power plants by generating capacity are coal-fired, and only 2 wind farms are in the top 10. When ranked by generation, 4 of the top 10 plants are wind-powered and 3 are coal-fired.41,42
Natural gas-fired power plants contributed 9% of Iowa's in-state generation in 2022, with total generation from natural gas the second-lowest since 2017. Iowa has had no nuclear power generation since mid-2020 after the state's one nuclear plant stopped operating.43 The 601-megawatt Duane Arnold nuclear power plant closed in August 2020 when storm winds damaged the power station's cooling towers. The plant's owner plans to build a 200-megawatt solar power farm at the site by the end of 2024.44,45,46 The state's remaining 3% of electricity generation came from hydropower, solar, biomass, and petroleum.47
Since 2008, Iowa has generated more electricity each year than the state consumed. The excess power is sent to other states over the regional electric grid.48 Iowa ranks in the top 10 states in total electricity sales per capita.49 Almost half of electricity sales in Iowa go to the industrial sector, nearly three-tenths go to the residential sector, and the commercial sector accounts for slightly more than one-fourth.50 Iowa ranks among the 10 states with the lowest average electricity price.51 About one in four Iowa households rely on electricity for home heating.52
Petroleum
Iowa is not a crude oil-producing state and does not have any proved oil reserves.53,54 Of more than 100 exploratory wells drilled in the state, only a handful ever produced oil. Those wells no longer produce, and their combined production was less than 500 barrels of crude oil.55,56 Iowa does not have any oil refineries and relies on pipelines to bring in petroleum products from other states.57 Nearly 12,000 miles of petroleum product pipelines cross the state.58
One in eight Iowa homes heat with propane, almost triple the national rate.
The transportation sector accounts for about three-fifths of Iowa's petroleum use.59 About 41% of the petroleum consumed in Iowa is used as motor gasoline, 30% is diesel fuel, and 23% is propane. Jet fuel, residual fuel, and other petroleum products account for the rest.60 Conventional motor gasoline without ethanol can be sold statewide in Iowa, although almost all U.S. gasoline is blended with at least 10% ethanol.61,62 About 330 public fueling stations in the state dispense E85, a blend of motor gasoline with 85% ethanol, and about 310 stations sell biodiesel.63,64 Iowa's industrial sector makes up about three-tenths of the state's petroleum consumption. The remaining one-tenth of petroleum use is split between the state's residential and commercial sectors. A small amount of petroleum is used by the electric power sector.65 The state's petroleum consumption includes hydrocarbon gas liquids (HGL), mostly propane. Iowa ranks fourth among the states in HGL consumption. The industrial sector consumes more than two-thirds of the HGLs, where farmers use propane to dry their harvested corn crop.66,67,68 About one in eight Iowa households heats with propane, almost triple the national rate.69
Natural gas
Iowa does not have any natural gas reserves or production, but the state is crossed by several interstate natural gas pipeline systems.70,71,72 Natural gas enters Iowa by pipelines primarily from Minnesota, Nebraska, and Missouri. About three-fourths of the natural gas that enters Iowa exits the state and continues on to Illinois and Minnesota on its way to markets in those states and farther east.73,74,75 Some of the gas is also stored in Iowa's four natural gas storage fields that together can hold 288 billion cubic feet of gas, which accounts for about 3% of U.S. natural gas storage capacity by volume.76
Natural gas accounts for about one-fourth of the total energy consumed in Iowa.77 In 2022, the industrial sector accounted for 58% of the natural gas consumed in the state. Iowa's residential sector, where 6 out of 10 households use natural gas as their primary heating fuel, accounted for 17% of natural gas use. The commercial sector consumed about 13%, and the electric power sector used 12%. A small amount of natural gas is also used in the transportation sector.78,79
Coal
Coal mining began in Iowa in the 1840s and continued until the 1990s. Most of the coal mines were located in the southern half of the state and supplied coal to run the railroads that first reached Iowa in the 1860s.80 Today, there are no active coal mines in Iowa, but the state still has about 1.1 billion tons of estimated recoverable coal reserves, located primarily in south-central Iowa.81,82
Almost all of the coal consumed in Iowa is brought by rail from Wyoming and delivered to power plants. A few small coal shipments from Wyoming, Illinois, and Kentucky are also delivered to Iowa's industrial, commercial, and institutional users.83 In 2022, Iowa ranked 16th among the states in coal use for electricity generation.84
Endnotes
1 Hillaker, Harry, Iowa's Climate, The Community Collaborative Rain, Hail & Snow Network, State Climate Series, accessed July 5, 2023.
2 Rodriguez, Hannah, "No state produces more corn than Iowa. Here are more ways Iowa farmers lead the nation," Des Moines Register (December 30, 2021).
3 U.S. Energy Information Administration (EIA), State Energy Data System, Table P4B, Primary Energy Production Estimates, Biofuels, in Thousand Barrels, Ranked by State, 2021.
4 U.S. Department of Energy, Energy Efficiency and Renewable Energy, WINDExchange, Wind Energy in Iowa, Maps & Data, accessed July 5, 2023.
5 Current Results, Weather and Science Facts, Days of Sunshine per Year in Iowa, accessed July 5, 2023.
6 U.S. Department of Energy, National Renewable Energy Laboratory, Geospatial Data Science, Solar Resource Maps and Data, Iowa, accessed July 5, 2023.
7 U.S. EIA, Annual Coal Report 2021 (October 18, 2022), Table 15, Recoverable Coal Reserves at Producing Mines, Estimated Recoverable Reserves, and Demonstrated Reserve Base by Mining Method, 2021.
8 U.S. EIA, Natural Gas Gross Withdrawals and Production, Gross Withdrawals, Annual-Million Cubic Feet, 2017-22.
9 U.S. EIA, Crude Oil Production, Annual-Thousand Barrels per Day, 2017-22.
10 U.S. EIA, Annual Coal Report 2021 (October 18, 2022), Table 1, Coal Production and Number of Mines by State and Mine Type, 2021 and 2020.
11 U.S. EIA, State Energy Data System, Table C14, Total Energy Consumption Estimates per Capita by End-Use Sector, Ranked by State, 2021.
12 U.S. EIA, State Energy Data System, Table C1, Energy Consumption Overview: Estimates by Energy Source and End-Use Sector, 2021.
13 U.S. EIA, State Energy Data Systems, Table C11, Energy Consumption Estimates by End-Use Sector, Ranked by State, 2021.
14 Iowa Area Development Group, Target Industries, accessed July 5, 2023.
15 U.S. Bureau of Economic Analysis, Interactive Data, Regional Data, GDP & Personal Income, Annual Gross Domestic Product (GDP) by State, GDP in current dollars, NAICS, Iowa, All Statistics in Table, 2021.
16 U.S. EIA, State Energy Data System, Table C1, Energy Consumption Overview: Estimates by Energy Source and End-Use Sector, 2021.
17 U.S. EIA, State Energy Data System, Table P4B, Primary Energy Production Estimates, Biofuels, in Thousand Barrels, Ranked by State, 2021.
18 U.S. EIA, U.S. Fuel Ethanol Plant Production Capacity (August 8, 2022), Detailed nameplate capacity of fuel ethanol plants by Petroleum Administration for Defense District (PAD District) are available in XLS.
19 U.S. EIA, State Energy Data System, Table F25, Fuel ethanol consumption estimates, 2021.
20 U.S. Ethanol Plants, Operational, Ethanol Producer Magazine, updated April 16, 2023.
21 U.S. EIA, Table P4B, Primary Energy Production Estimates, Biofuels, in Thousand Barrels, Ranked by State, 2021.
22 U.S. EIA, U.S. Biodiesel Plant Production Capacity (August 8, 2022), Detailed annual production capacity by plant is available in XLS format.
23 U.S. EIA, State Energy Data System, Table F26, Biodiesel Consumption Estimates, 2021.
24 U. S. EIA, Electricity Data Browser, Net generation for all sectors (thousand megawatthours), Annual, 2019-22.
25 U.S. EIA, Electric Power Monthly (February 2023), Tables 1.3.B, 1.11.B, 1.14.B.
26 U.S. EIA, Electricity, Preliminary Monthly Electric Generator Inventory (based on Form EIA-860M as a supplement to Form EIA-860), Inventory of Planned Generators as of December 2022, Plant State: Iowa, Technology: Onshore Wind Turbine.
27 U.S. Department of Energy, Energy Efficiency and Renewable Energy, WINDExchange, Wind Energy in Iowa, Maps & Data, accessed July 6, 2023.
28 U.S. EIA, U.S. Energy Atlas, All Energy Infrastructure and Resources, Iowa, accessed July 6, 2023.
29 U.S. EIA, Electricity Data Browser, Net generation for all sectors (thousand megawatthours), Annual, 2019-22.
30 U.S. EIA, Electricity, Preliminary Monthly Electric Generator Inventory (based on Form EIA-860M as a supplement to Form EIA-860), Inventory of Operating Generators as of June 2023, Plant State: Iowa, Technology: Conventional Hydroelectric.
31 "American Hydro to modernize two units at 142-MW Keokuk hydroelectric plant," Hydro Review (October 16, 2020).
32 U.S. EIA, Electricity Data Browser, Net generation for all sectors (thousand megawatthours), Annual, 2019-22.
33 U.S. EIA, Electricity, Preliminary Monthly Electric Generator Inventory (based on Form EIA-860M as a supplement to Form EIA-860), Inventory of Operating Generators as of June 2023, Plant State: Iowa, Technology: Solar Photovoltaic.
34 National Renewable Energy Laboratory, Geospatial Data Science, Solar Resource Maps and Data, U.S. Annual Solar GHI, Iowa, February 22, 2018.
35 U.S. EIA, Electricity, Preliminary Monthly Electric Generator Inventory (based on Form EIA-860M as a supplement to Form EIA-860), Inventory of Operating Generators as of June 2023, Plant State: Iowa, Technology: Landfill gas, Other Waste Biomass.
36 TrackMyElectricity, AgriReNew Methane Center, About, accessed July 6, 2023.
37 "WM Plans to Expand Iowa Landfill Gas Recovery Facility," Waste Today Magazine (July 16, 2013).
38 U.S. EIA, Monthly Densified Biomass Fuel Report (August 1, 2023), Highlights, Table 1, Densified biomass fuel manufacturing facilities in the United States by state, region, and capacity, May 2023, Download.
39 NC Clean Energy Technology Center, DSIRE, Iowa Alternative Energy Law, updated November 18, 2012.
40 U.S. EIA, Electric Power Monthly (February 2023), Table 6.2.A.
41 U.S. EIA, Electricity Data Browser, Net generation for all sectors (thousand megawatthours), Annual, 2019-22.
42 U.S. EIA, Iowa Electricity Profile 2021, Table 2A, Ten largest plants by capacity, Table 2B, Ten largest plants by generation, 2021.
43 U.S. EIA, Electricity Data Browser, Net generation for all sectors (thousand megawatthours), Annual, 2019-22.
44 U.S. EIA, U.S. Nuclear Generation and Generating Capacity, 2019, 2020.
45 Steppe, John, "Duane Arnold nuclear plant won't restart after Iowa derecho damage," The Gazette (August 25, 2021).
46 NextEra Energy Resources, Duane Arnold Solar Project, accessed July 7, 2023.
47 U.S. EIA, Electricity Data Browser, Net generation for all sectors (thousand megawatthours), Annual, 2019-22.
48 U.S. EIA, Iowa Electricity Profile 2021, Table 10, Supply and disposition of electricity, 1990 through 2021.
49 U.S. EIA, State Energy Data System, Table C17, Electricity Retail Sales, Total and Residential, Total and per Capita, Ranked by State, 2021.
50 U.S. EIA, Electricity Data Browser, Retail sales of electricity (million kilowatthours), 2019-22.
51 U.S. EIA, Electric Power Monthly (February 2023), Table 5.6.B.
52 U.S. Census Bureau, House Heating Fuel, Table B25040, 2021 ACS 1-Year Estimates Detailed Tables, Iowa.
53 U.S. EIA, Crude Oil Production, Annual-Thousand Barrels, 2017-22.
54 U.S. EIA, Crude Oil Proved Reserves, Reserves Changes, and Production, Proved Reserves as of 12/31, Annual, 2016-21.
55 Anderson, Raymond R., Oil Exploration in Iowa, adapted from Iowa Geology 1992, No. 17, Centennial Edition, Iowa Department of Natural Resources.
56 Iowa Department of Natural Resources, McKay, Robert M., Mineral Resource Facts, Energy Resources, Oil and Gas, accessed July 7, 2023.
57 U.S. EIA, Number and Capacity of Petroleum Refineries, Total Number of Operable Refineries as of January 1, 2018-23.
58 U.S. Department of Energy, State of Iowa Energy Sector Risk Profile, p. 4, accessed July 7, 2023.
59 U.S. EIA, State Energy Data System, Table F16, Total Petroleum Consumption Estimates, 2021.
60 U.S. EIA, State Energy Data System, Table C2, Energy Consumption Estimates for Major Energy Sources in Physical Units, 2021.
61 Gardner, K. W., U.S. Gasoline Requirements, American Petroleum Institute (January 2018).
62 U.S. EIA, "Almost all U.S. gasoline is blended with 10% ethanol," Today in Energy (May 4, 2016).
63 U.S. Department of Energy, Energy Efficiency and Renewable Energy, Alternative Fuels Data Center, Alternative Fueling Station Locator, Ethanol (E85), Iowa, and Biodiesel (B20 and above), accessed July 7, 2023.
64 Hardy, Kevin, "Why Iowans will likely see more E15 and E85 gas at the pump soon," Des Moines Register (June 5, 2017).
65 U.S. EIA, State Energy Data System, Table F16, Total Petroleum Consumption Estimates, 2021.
66 U.S. EIA, "Propane Use for Crop Drying Depends on Weather and Corn Markets as well as Crop Size," Today in Energy (October 2, 2014).
67 U.S. EIA, State Energy Data System, Table F11, Hydrocarbon Gas Liquids Consumption Estimates, 2021.
68 U.S. EIA, Hydrocarbon gas liquids explained, Where do hydrocarbon gas liquids comes from?, updated September 13, 2022.
69 U.S. Census Bureau, House Heating Fuel, Table B25040, 2021 ACS 1-Year Estimates Detailed Tables, Iowa, United States.
70 U.S. EIA, Natural Gas Reserves Summary as of Dec. 31, Dry Natural Gas, Annual, 2016-21.
71 U.S. EIA, Natural Gas Gross Withdrawal and Production, Gross Withdrawals, Annual-Million Cubic Feet, 2017-22.
72 U.S. EIA, U.S. Energy Atlas, All Energy Infrastructure and Resources, Iowa, accessed July 17, 2023.
73 U.S. EIA, International and Interstate Movements of Natural Gas by State, Iowa, Annual, 2016-21.
74 U.S. EIA, About U.S. Natural Gas Pipelines, Natural Gas Pipelines in the Midwest Region, accessed July 17, 2023.
75 U.S. EIA, About U.S. Natural Gas Pipelines, Natural Gas Pipelines in the Central Region, accessed July 17, 2023.
76 U.S. EIA, Underground Natural Gas Storage Capacity, Total Number of Existing Fields, 2016-21 and Total Storage Capacity, Annual, 2016-21.
77 U.S. EIA, State Energy Data System, Table C1, Energy Consumption Overview: Estimates by Energy Source and End-Use Sector, 2021.
78 U.S. Census Bureau, House Heating Fuel, Table B25040, 2021 ACS 1-Year Estimates Detailed Tables, Iowa.
79 U.S. EIA, Natural Gas Consumption by End Use, Iowa, Annual, 2017-22.
80 Iowa Pathways, Types of Business and Industry, accessed July 18, 2023.
81 U.S. EIA, Annual Coal Report 2021 (October 18, 2022), Table 1, Coal Production and Number of Mines by State and Mine Type, 2021 and 2020; Table 15, Recoverable Coal Reserves at Producing Mines, Estimated Recoverable Reserves, and Demonstrated Reserve Base by Mining Method, 2021.
82 U.S. EIA, U.S. Energy Atlas, All Energy Infrastructure and Resources, Iowa, accessed July 18, 2023.
83 U.S. EIA, Annual Coal Distribution Report 2021 (October 18, 2022), Domestic Distribution of U.S. coal by: Destination State, consumer, destination and method of transportation, Iowa, Table DS-13, Domestic Coal Distribution, by Destination State, 2021.
84 U.S. EIA, Electric Power Monthly (February 2023), Table 4.6.B.
Other Resources
Energy-Related Regions and Organizations
- Petroleum Administration for Defense District (PADD): 2
- Regional Transmission Organization (RTO) and Independent System Operator (ISO): Midcontinent Independent System Operator (MISO), Southwest Power Pool (SPP)
- North American Electric Reliability Corporation (NERC) ERO Enterprise: Regional Entities: Midwest Reliability Organization (MRO)
Other Websites
- Iowa Energy Office
- Iowa Utilities Board
- Iowa Department of Human Rights, Division of Community Action Agencies, Low-Income Home Energy Assistance (LIHEAP)
- Iowa Department of Human Rights, Division of Community Action Agencies, Weatherization Assistance Program
- Iowa Department of Agriculture and Land Stewardship, Iowa Renewable Fuel Infrastructure Program
- Iowa Department of Natural Resources, Underground Storage Tanks
- Iowa Department of Natural Resources, Oil, Gas and Metallic Mineral Regulatory Information
- Iowa Department of Agriculture and Land Stewardship, Iowa Mineral Program
- Iowa Energy Center Board
- EIA Iowa Flickr Album
- U.S. Department of Health and Human Services, Administration for Children and Families, Office of Community Services, Low Income Home Energy Assistance Program (LIHEAP)
- Alternative Fuels Data Center, Federal and State Laws and Incentives
- Benefits.Gov, Housing and Public Utilities
- NC Clean Energy Technology Center, Database of State Incentives for Renewables and Efficiency (DSIRE)
- National Association of Regulatory Utility Commissioners (NARUC)
- National Association of State Energy Officials (NASEO)
- National Conference of State Legislatures (NCSL), Research and Policy
- National Renewable Energy Laboratory (NREL), Geospatial Data Science Data and Tools
- U.S. Geological Survey (USGS), Publications
- Western Area Power Administration
- U.S. Geological Survey, Maps
- Lawrence Livermore National Laboratory, Energy Flow Charts
- National Renewable Energy Laboratory, State and Local Planning for Energy (SLOPE)
- EIA Natural Gas Storage Dashboard
- EIA Energy Disruptions
- U.S. Department of Agriculture (USDA), Rural Development, Energy Programs